How to Estimate Sales Using Inventory Web-Scraped Data
A powerful use case for web data
About Data Boutique
Data Boutique is a data marketplace focused on web scraping. We make it simpler to match those who collect data with those who know how to use it.
How to Estimate Sales Using Inventory Web-Scraped Data
What is web-scraped inventory data
Some e-commerce websites disclose stock levels of their available products.
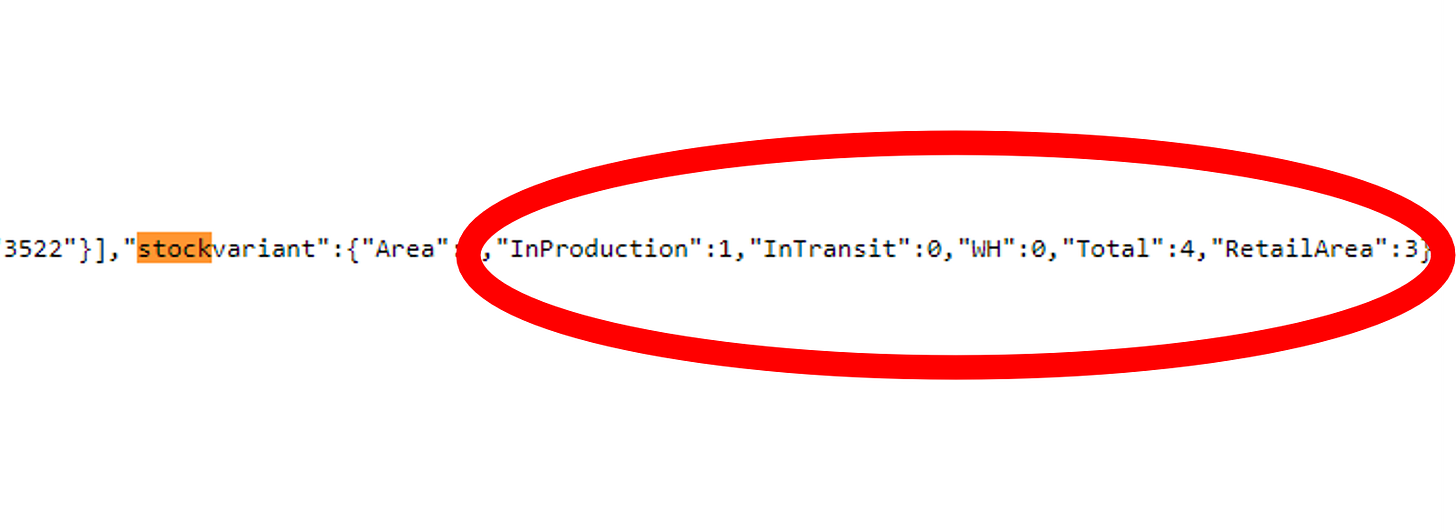
Some do it to offer better customer service, like IKEA, or to communicate scarcity and give a sense of urgency, like sneaker-heads Mekka StockX. Other websites sell one-item-only products, like second-hand clothing website Vestiaire Collective or Tesla’s internal used vehicle store. Others, even if not displaying the information graphically, have it in plain HTML code:
Inventory data can be accessed with web-scraping techniques and be a powerful source for competitive and investment intelligence
How to estimate sales from inventory data
Inventory is point-in-time information on the quantity of an item. Monitoring how this quantity changes gives insights into how many items have been sold.
IKEA example: the quantity of the metal bowl BLANDA BLANK (see picture) in a store of Milan is 2.439 on the 26th of February 2024.
The next day, this value is 2.418, which is 21 units lower
We can assume that in the time between our observations, in the Milan store of IKEA, 21 metal bowls BLANDA BLANK were sold at 6.95 EUR each, for a gross value of 146 EUR.
Suppose we repeat this for every item in the store, for every IKEA store worldwide, for every day of the year: We have a real-time hyper-detailed revenue estimate for IKEA.
Assumptions
As inventory changes for many reasons, not only sales, some assumptions must be made to interpret data correctly. The key points we need to consider are:
Frequency: The more frequent observations, the better. Daily (or intraday) capture is desirable, but that can drive up costs. I worked on a project on a specific luxury website and found that weekly snapshots were 98% as reliable as 20-minute snapshots (at a 99.7% lower cost!). Industry-specific considerations apply: Fast-moving consumer goods are different than luxury bags.
Number of stock points: We need to understand (or at least estimate) how many stock points (warehouses) serve a specific website. If a website is served by a central warehouse for all of Europe, we need only one extraction (i.e., France) that represents all others. But if, like the IKEA case, we have one stock point for every store.
Type of stock points: Some websites disclose online and offline warehouses, so we know we have visibility for online and offline sales; sometimes, instead, we have only visibility on the online warehouses and zero visibility of what happens offline. This is a material difference when we want to understand what kind of revenue we are trying to estimate.
Restocking policies: Having a good awareness of the restocking policies of the industry is key for data interpretation. The more we know, the more our estimate will be correct. Are goods restocked once or twice every season (like in luxury goods) or at intraday frequency? This has a direct impact on our choice of frequency and data interpretation.
Inventory transfers: This is similar to restocking, except the goods move between one warehouse and another. We might notice -1.000 units less in IKEA store A and two days later +1.000 units more of the same object in IKEA store B.
“Dead stock” management (unsold inventory): What happens when a product reaches the end of its shelf life? Monitoring this is key for some important ESG-related metrics, like unsold inventory.
Canceled/Returned orders inventory management: What happens when an order is canceled? How does it appear on inventory? We found this behavior can be a source of a lot of noise in the data if interpreted incorrectly.
Noise: Data is only as good as the system that generates it. Delays, errors, lags, misalignments, coding errors, manual data entry errors. Be prepared to have a model that keeps that into account.
Differences with other data sources
Before building a dataset from web scraping, it is worth understanding how this compares to alternative datasets in the market.
One popular dataset among professional investors is credit (and debit) card transaction data. This data contains financial transactions of specific user groups.
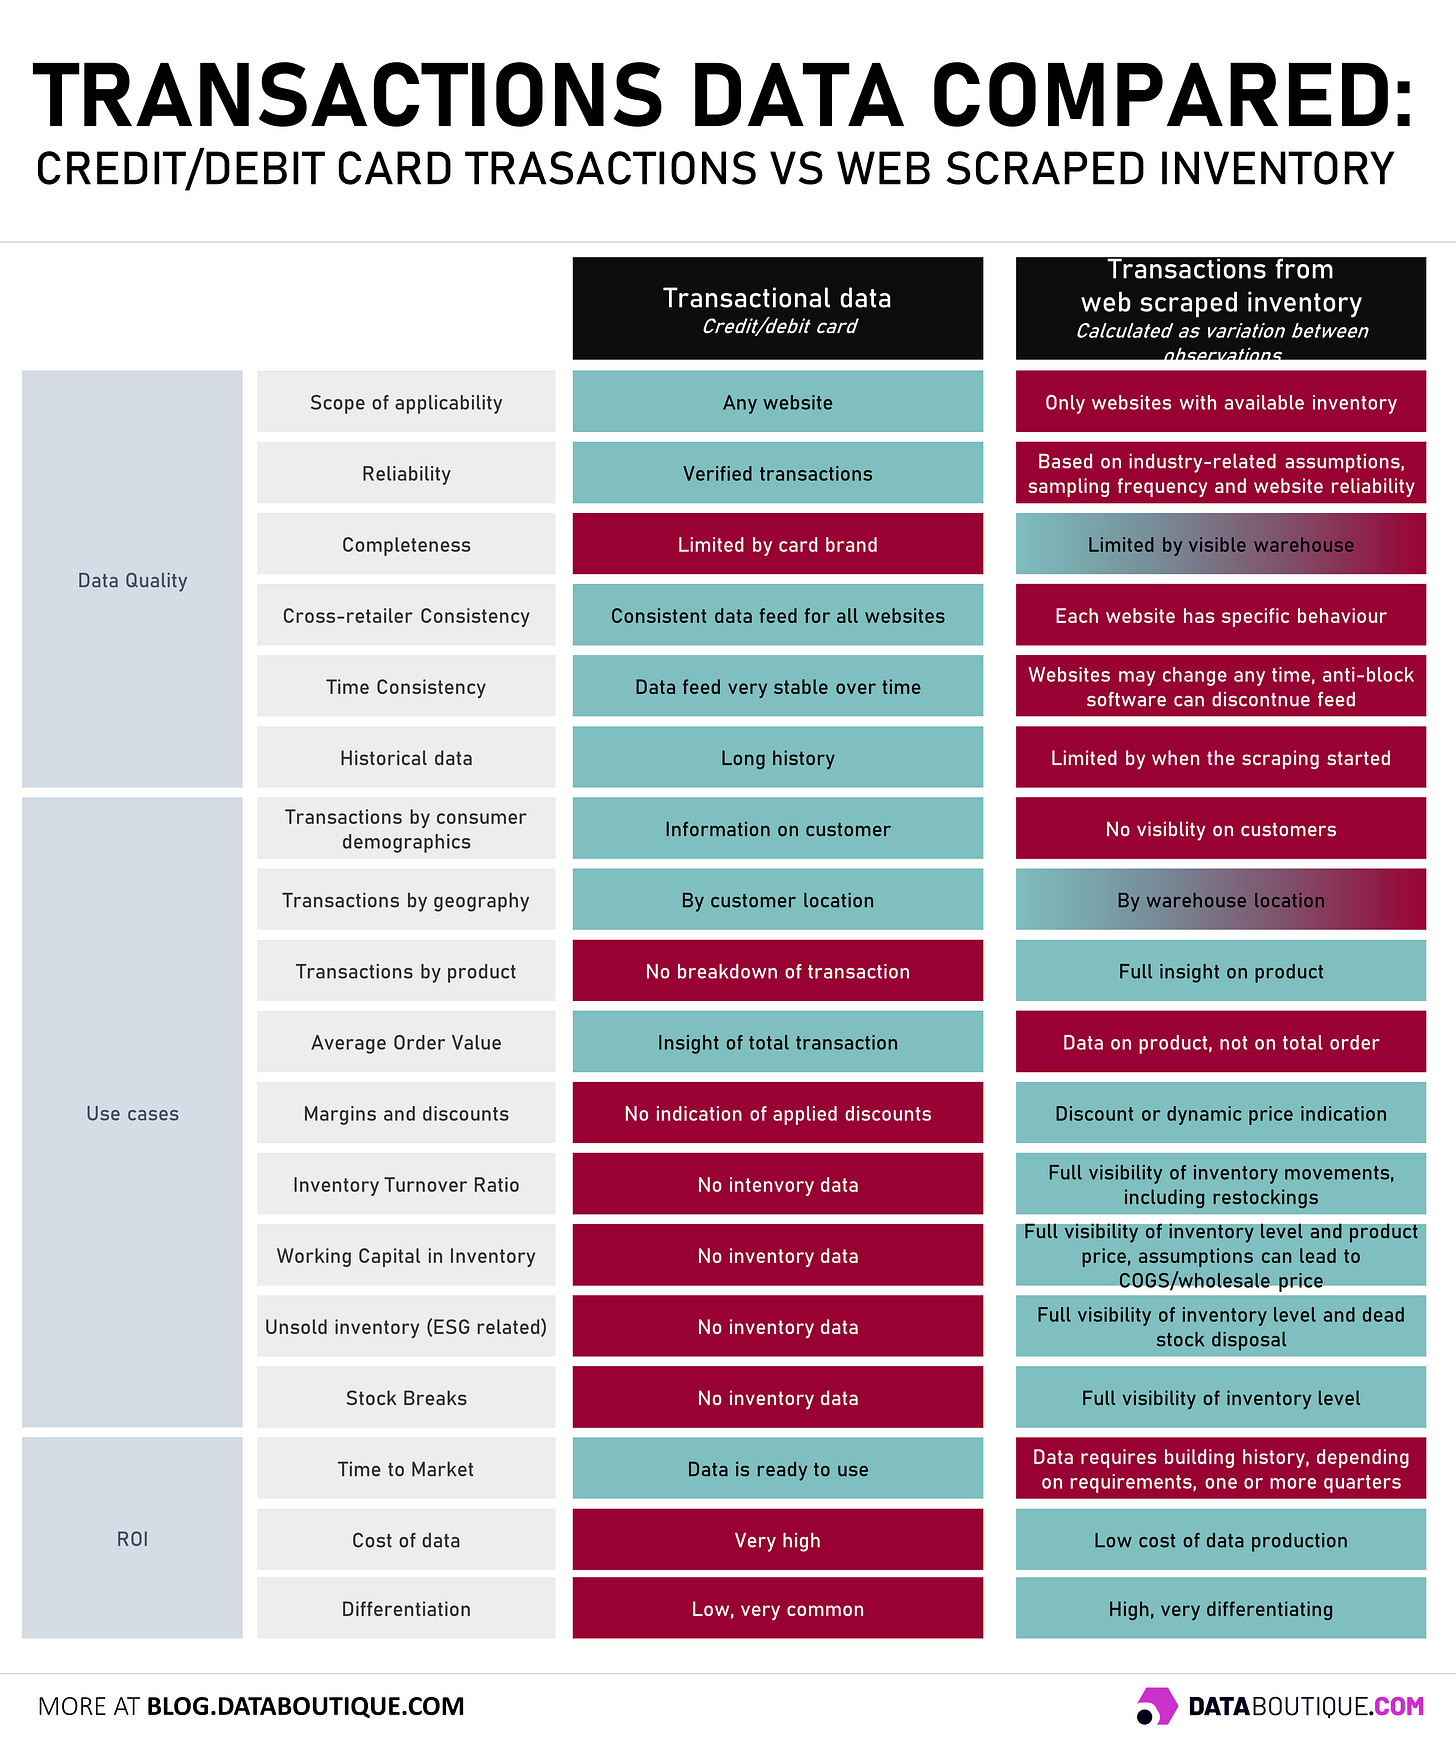
While credit card data is more reliable in terms of absolute numbers, has a consistent history, and will be more stable over time, web-scraped data can offer deeper insights, and given the cost difference of collecting the latter, in our previous experiences, it is a valid integration, if not an alternative to the former.
Data Quality
Scope: Credit card data works the same on every website, regardless of whether they disclose inventory. Web-scraped data requires the website to disclose it.
Reliability: Credit card data are real transactions, while inventory-based calculations are estimates and heavily linked to the assumptions made.
Completeness: Credit card data are usually limited by card or bank’s brand, often related to the demographics of the user base. On the other hand, web-scraped data can show all transactions but is limited to the available warehouses.
Cross-retailer consistency: Credit card data have the same feed regardless of the website. Web scraping depends on the website and what kind of information is disclosed.
Time consistency: Credit card data is a consistent feed (doesn’t change structure) over time. On the contrary, web scraping is exposed to website changes and anti-block technology. If a day’s collection is missing, it is lost.
Historical data: Credit card data go back in time for years. Web scraping is only as old as the day you start doing it. This is a differentiation element for those who start collecting it.
Use Cases
Transactions by demographics: Credit card data can be enriched with (anonymized) consumer data, giving insights into demographics. Web scraping has no visibility on the demand side and only makes assumptions based on the change in supply.
Transactions by geography: Credit card data can be enriched with location data (for physical transactions) or user (anonymized) data for online transactions. Web scraping can go only as far as location information of the underlying stock point.
Transactions by product: Credit card data has almost no data on the products within an order; they see the transaction as a whole. Web scraping on the contrary has visibility on products, category, composition, description, price and discounts.
Average Order Value (AOV): Credit card data show the order as a whole, giving insights on average order value (AOV), whereas web-scraped cannot see if a product was purchased alone or in a group with others.
Margins and discounts: Credit card data only shows the price paid. Webs scraped data have visibility on the discount offered and can be very precious for estimates or models on margins.
Inventory Turnover Ration (ITR): Web scraped data gives the metrics for all inventory KPIs, including ITR and sales velocity.
Working Capital Invested in Inventory: Once embedded in the model, the cost (or value) for items stored in a warehouse, we can have a real-time estimate for working capital invested in it.
Unsold inventory (ESG related): Unsold inventory is a huge topic in many industries, with big implications in ESG. Web scraped data can measure this, whereas credit card data lacks insight.
Stock Breaks: When an item is Out of Stock, it ceases making sales. Web scraped data can identify this.
ROI - Return on Investment of Data
Time-to-Market (TTM): The time it takes from when you get the data until you can start actually using it is in favor of credit card data because it is ready to use. Web scraped data has an initial time investment required to build history.
Cost of data: The big downside of credit card data is its cost. Web scraping, especially when accessed via marketplaces like Data Boutique, has data costs of orders of magnitude lower.
Differentiation: The big point. Credit card data are extremely popular and spread in the investment community, offering little differentiation. Web scraping, given the investment in time it takes to build history and the fact that every website is a separate investment, is still underused.
Conclusions
The reason for this deep-dive into inventory data is that we are releasing the Ecommerce Inventory Schema on Data Boutique, where this kind of data can be accessed faster and easier than web scraping first-hand.
Accessing web-scraped data on inventory can be a differentiating asset for financial analysts, market researchers, and consumer goods competitive intel.
We hope this piece helps contextualize the power and opportunity of web-scraped inventory data for a future set of applications that use it.
If you’re interested in collecting inventory data (and potentially selling it on Data Boutique), we recommend these readings:
About the Project
Data Boutique aims to increase web data adoption by creating a win-win environment for data sellers and buyers. If you operate in data, join our community.
Thanks for reading and helping our community grow.


